Refine

Contents
After a first pass of programming the periodic error from your mount you may wish to see how well your mount's periodic error was corrected. You can then optionally refine the periodic error correction curve. PEMPro gives you the capability to do this with the Refine tab (see below).
NOTE: Before refining a PEC curve it is useful to view the Frequency Spectrum tab to see which frequencies may still need correcting. When creating a PEC curve only select the frequencies that are present in both the original data and in the acquired data with the PEc curve programmed and PEC enabled. To do this start two instances of PEMPro. Load the raw PEC data (.txt extension) in one instance and click the Frequency Spectrum tab. Then, in the other instance of PEMPro, load the raw PEC data collected with PEC enabled, then click the Frequency Spectrum tab.
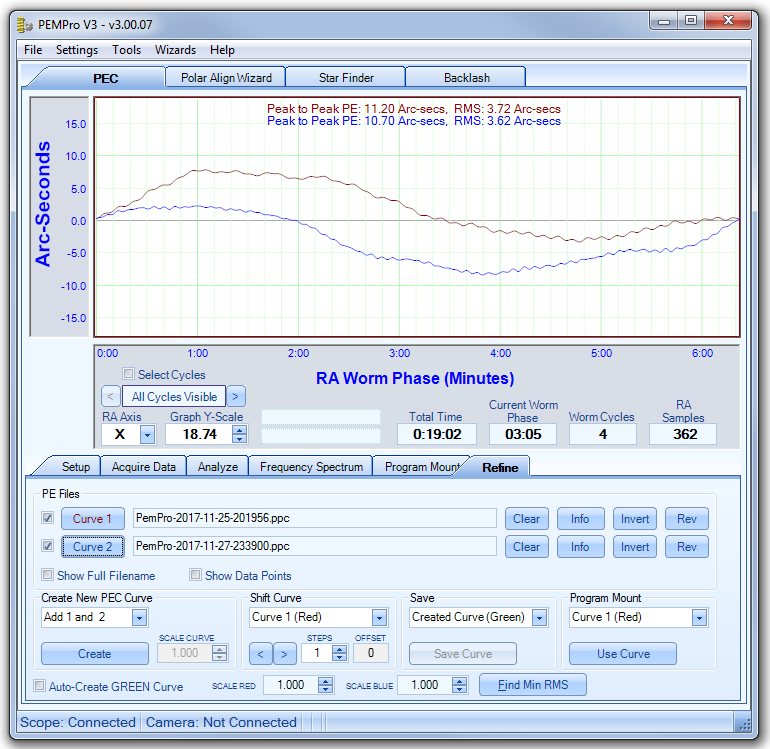
First, load in Curve 1 (red) the periodic error curve created without the mount's periodic error management active. Next load with Curve 2 (blue) the periodic error after the mount was programmed. In the Create New PE Curve group box select Add 1 and 2. This should produce a third curve, which will be green.
To program the new curve select Created Curve(Green) in the Program Mount group box then press the Use Curve button. This will transfer the curve to the Program Mount tab, ready to be played back to the mount.
NOTE: If you are using a mount that can have a curve directly uploaded to it (like LX200GPS/R/ACF, Astro-Physics GTO, Celestron, etc.) you will not want to click Use Curve. You will want to switch to the mount's dedicated tab in PEMPro and click From Created PE Curve. |
Other features of this page:
Clear: clears the filename and its curve on the graph.
Info: Displays information about the PPC file.
Invert: Inverts every data point in the curve. Each data point is multiplied by -1.
Reverse: Reverses the data points in the curve. The first point becomes the last point, second point becomes second to last data point, etc.
Show Full Filename: If checked will display the full path name. If not checked just the filename will display.
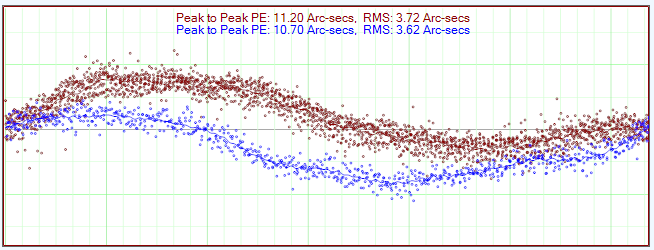
Show Data Points: If checked will also show the original data points corresponding to the curve as shown in the example below:
Refine Curve Controls
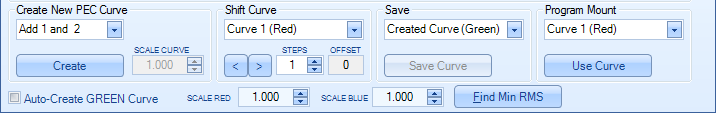
Create New PE Curve: Press the Create button to perform the action defined and apply the scale factor in the Scale Curve text box.
Actions when clicking "Create":
No Curve: Removes the created (green) curve.
Subtract 1 from 2: Subtracts Curve 1 (red) from Curve 2 (blue) to create the green curve.
Subtract 2 from 1: Subtracts Curve 2 (blue) from Curve 1 (red) to create the green curve.
Add 1 and 2: Adds Curve 1 and Curve 2 curves to create the green curve.
Average 1 and 2: Averages Curve 1 and Curve 2 curves to create the green curve.
Reverse 1: Reverses Curve 1 (last point becomes first point, etc.)
Reverse 2: Reverses Curve 2 (last point becomes first point, etc.)
Scale Curve: After creating the green curve, it will be scaled by this factor. (Thus, when set = 1.000 the green curve to not scale the curve)
Shift Curve: This might be used if the PEC's phase might need adjusting. Shift the curve left or right by the appropriate number of units. Press the Info button for the files to see the number of steps in each curve. Usually the value is 1000 steps per worm cycle. So if the worm cycle is 1000 seconds long each step would represent 1 second.
Auto-Create GREEN Curve:
When enabled the GREEN curve is automatically created using the action currently set in the "Create New PEC Curve" group box (e.g. "Add 1 to 2"). Any changes to the RED or BLUE curves automatically recalculates the GREEN curve.
SCALE RED: Scales the RED curve. This might be used if the curve's image scale is incorrect.
SCALE BLUE: Scales the BLUE curve. This might be used if the curve's image scale is incorrect.
Find Min RMS: Phase shifts the BLUE curve through its entire range to find the minimum resulting RMS of the resulting GREEN curve created from the RED and BLUE curves.
Save Curve: Save the curve to a file.
Use Curve: Select the curve then press Use Curve. The curve will be loaded and ready for playback by the playback engine.