PEC Simulator
The PEC Simulator works with PEMPro to simulate the periodic error in a mount. the tool is rather crude but still useful in helping understand how PEMPro works and some interesting details of PEC on your mount.
To use it you must first start the PEC Simulator from the Windows Start menu.

When the PEC Simulator starts for the first time you might see this security warning:
It is OK to click Keep Blocking. The Simulator does not try to connect to the internet (nor does PEMPro connect to the internet except when checking for a new version, or if you give permission when an unhandled error occurs). The Simulator is trying to create a UDP port so that it can communicate with PEMPro. PEMPro likewise will create a UDP port to talk to the simulator. PEMPro and the simulator only communicate on the local PC and never over the internet. PEMPro uses the UDP Protocol as a method of "intertask" communications because it is efficient and well supported by the various programming environments.
There is a default PPC file included with the installation. It is named PEMProSimulatorTestCurve.ppc. You can load a different file at any time with the File | Load menu. This can be any ".PPC" file that you have created with the Create PEC Curve dialog.

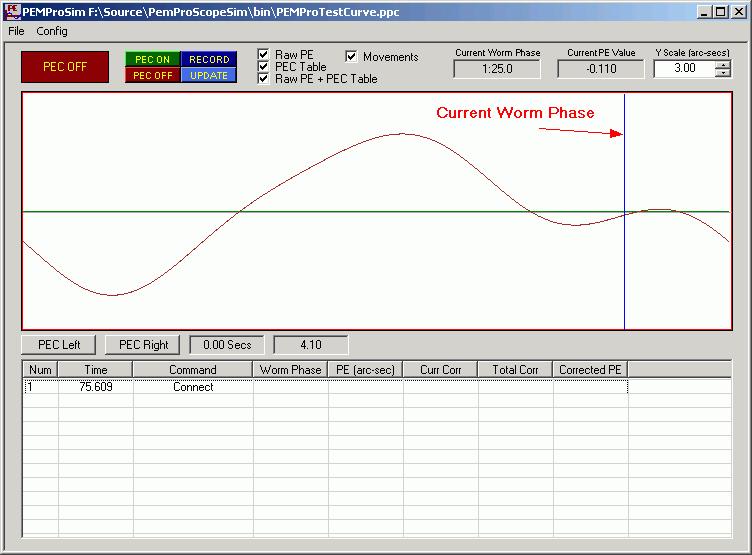
Once a curve is loaded you will see the curve in Maroon and a moving vertical blue line, which is the current worm phase. You can change the scale by adjusting the Y Scale (arc-secs) control.
There are four buttons on the upper left that allows you to set the state.
PEC On: Plays back the curve + the programmed PEC curve
PEC Off: Plays back the PEC curve only.
Record: Starts a PEC record from scratch. Before recording you should have Acquired Data for a couple cycles in PEMPro, then created a curve in the Create PEC Curve dialog and finally started a Program Mount. This is basically the same procedure you would do normally with a real mount.
Update: Starts a PEC record while playing back the original curve added to the last corrected curve.
There are also a few checkboxes at the top:
Raw PE: The raw PE is displayed.
PEC Table: The PEC table last recorded.
RAW PEC + PEC Table: Sum of the above two. This curve is effectively what you would see with your mount's PEC is on after training PEC.
Movements: Movements made to the mount when programming PEC. This always "shadows" the PEC Table.
Mount Parameters
You bring up the mount configuration in the menu by selecting Config | Mount Parameters...
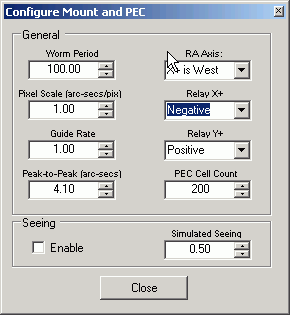
Worm Period: The loaded PPC file is scaled to the worm period you enter here. I usually choose about 100 seconds so I can collect a worm cycle of data quickly.
Pixel Scale: Sets the pixel scale. Usually there is no need to change this.
Guide Rate: Sets the emulated guide rate. Usually there is no need to change this.
Peak-to-Peak: The magnitude of the peak-to-peak periodic error of the loaded PPC file is scaled to what you enter here.
RA Axis: Selects the RA axis. Leave at the default.
Relay X+: Selects the direction of the Relay X+ move. If the periodic error gets worse when programming change this value from Positive to Negative or vice versa.
Relay Y+: Selects the direction of the Relay Y+ move.
PEC Cell Count: Number of PEC cells to simulate in this mount. LX-200's have 200 cells, AP mounts have 970, Paramount's have 1250, Celestron's have 88, etc.
Seeing: Check this to enable simulated seeing. It is a good idea to keep Simulated Seeing to less than 0.50.
Using the Simulator
1. Bring up the PEC Simulator then select "Simulator" and press in PEMPro.
2. Select "Simulator" as the scope to connect to on the PEMPro Setup page.
3. IMPORTANT: make sure that Use Autoguider Port... is checked!!!

4. Press Connect Scope in PEMpro . You will see a connect command in the Simulator's table.

5. In MaximDL or CCDSoft select Simulator as the camera type.
6. Press Connect Camera in PEMPro
7. In PEMPro switch to the Acquire Data tab and press Start. If an error that the star is too close to the edge appears then click Config | Reset All and press Start again.

8. After a cycle has completed press Stop. The graph may look like below. If asked, click OK to create the PEC curve.
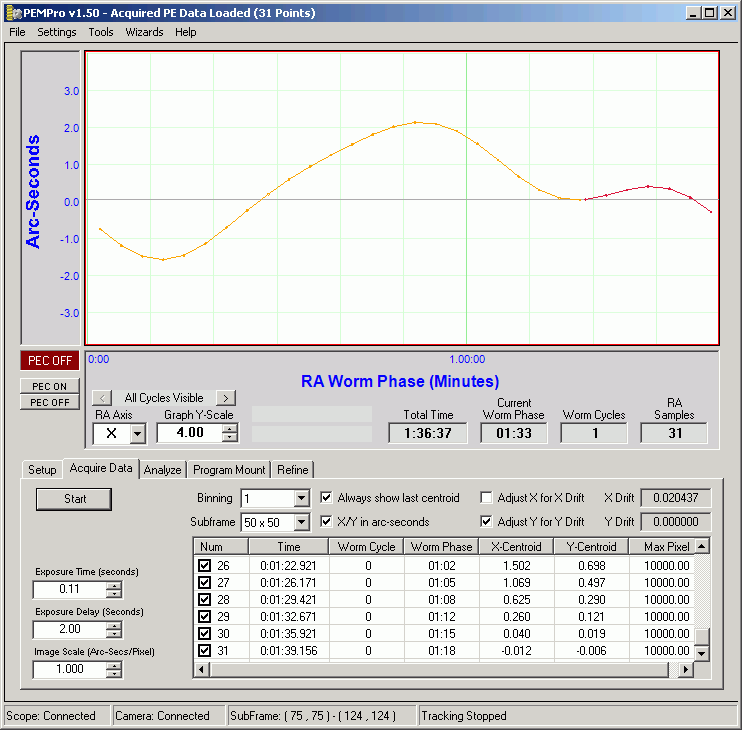
9. If the Create PEC dialog does not come up switch to the Analyze tab and press Create PE Curve. The dialog will look something like:
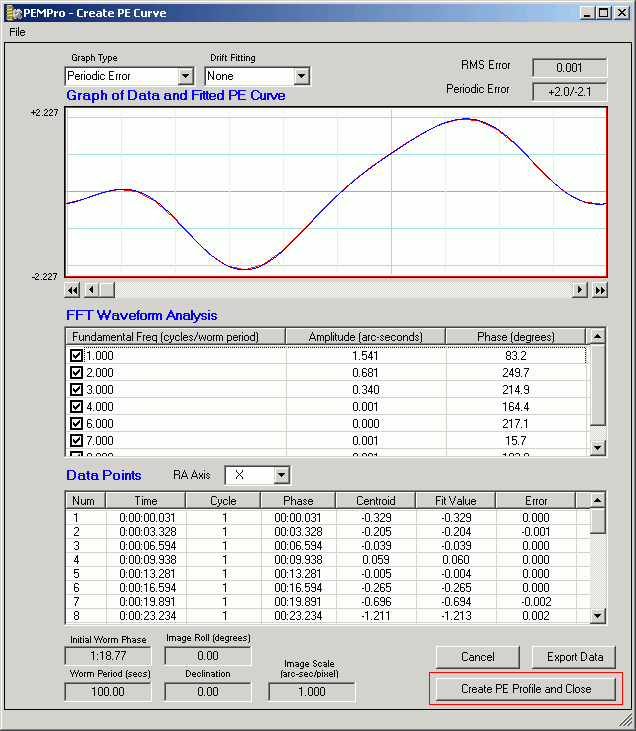
10. Press Create PE Profile and Close. Back in the main form the Program Mount tab will display. Press the Start Playback button.
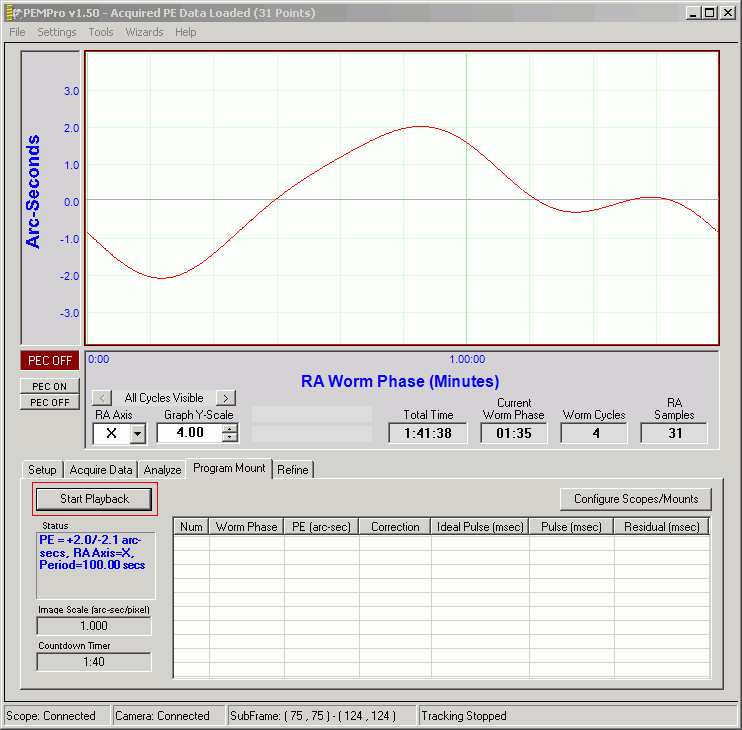
11. Now press the RECORD button in the Simulator:

12. Now you will see a few new curves appear on the graph. The graphs may look weird until at least one cycle has completed. You can turn on and off the various curves with the check boxes. The most important curve is the Corrected PEC as that is what the PEC would look like when programming a perfect mount. The curve looks jagged because the mount's PEC tables do not provide a continuous correction... only an update at regular intervals. You can investigate the effect of more PEC cells on the smoothness of this curve by changing the PEC Cell Count in the Mount Configuration parameters. Realize however in a real mount this value is fixed. For instance some Celestron mounts have 88 cells, LX200's have 200 cells, and Astro-Physics mounts have 970 cells. More cells is generally better.
If the periodic error gets worse when programming go to the Mount Parameters dialog and change the Relay X+ value from Positive to Negative or vice versa.
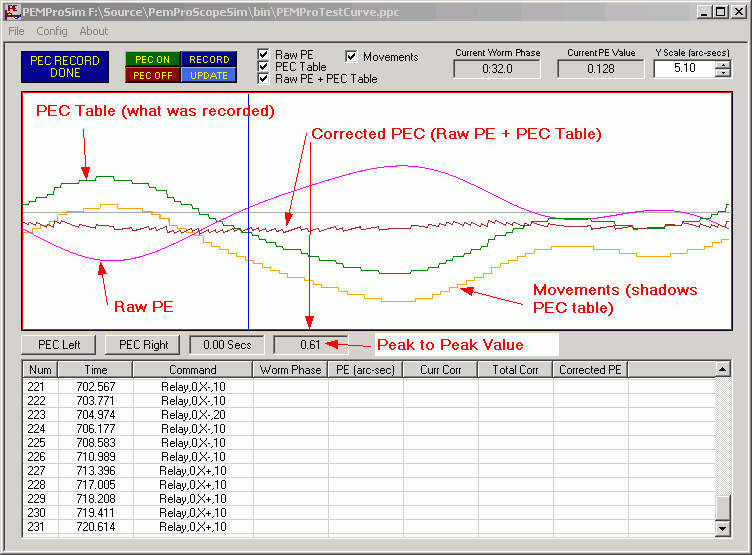
Note: The second box to the right of the PEC Right button is the peak-to-peak value of the Corrected PEC. |
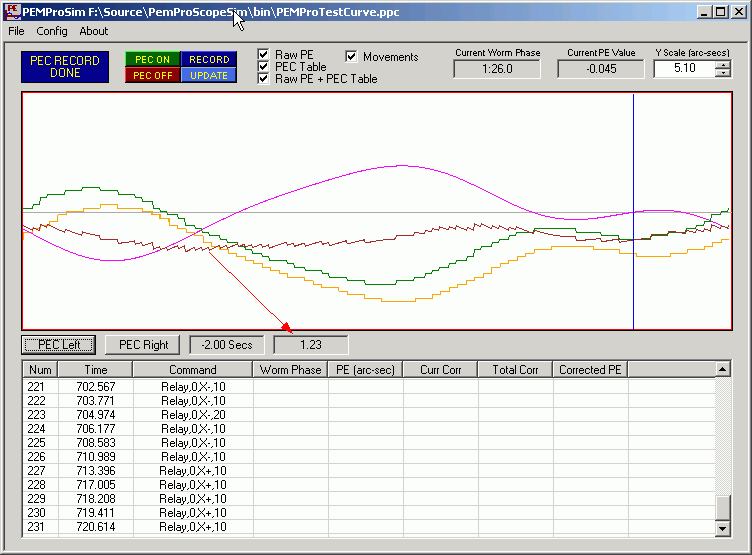
One last thing you can simulate is the effect of changing the PEC Phase. If you press the PEC Left or PEC Right buttons the PEC table is shifted left or right. You can see that just a few seconds of phase shift changes the corrected PEC significantly. For instance pressing PEC Left a few times produces this curve which now has a doubled PE (1.23 arc-seconds):
