Analyze

Contents
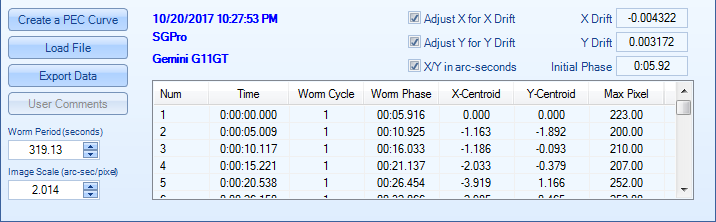
If you click on the Analyze page you will be able to analyze the data you have just acquired or a previous log file.
Create PE Curve : To analyze your PE data you press the Create PE Curve button to bring up another dialog that uses the Fast Fourier Transform (FFT) to extract periodic error terms from the data. The FFT is a numerical method that identifies periodic curves in the data. The more data points you have the better the analysis will be.
Load File: Use this button to analyze your old log files (or someone else’s). The log files are stored in the directory you specify on the Setup page. You can navigate to any directory on your PC with the Open file dialog that is displayed.
Export Data: This button allows you to export the data in the table so that it can be analyzed in a separate program like Excel.
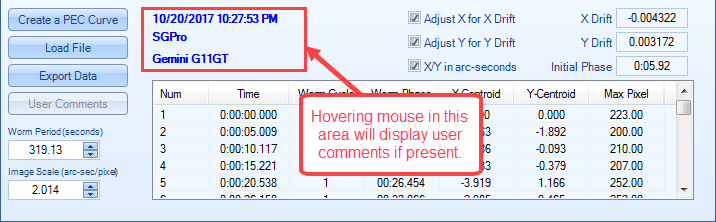
User Comments: This button will be enabled when there are user comments in the current file. Pressing the button will bring up a message box with the comments. You can also display the user comments by hovering the mouse over the area shown below. The comments will be displayed as a tool tip.
Worm Period: Worm period of the mount taken from the Acquired Data or a loaded file.
Image Scale: The image scale of the loaded data. Note that you can alter this before creating a PE Curve.
Adjust X for X Drift : If checked, will recalculate the X-centroids accounting for the 50-point moving average of the trend of the star’s movement in the X-axis. This feature does not alter the raw data in any way, just what is displayed in the graph and in the table.
Adjust Y for Y Drift : If checked, will recalculate the Y-centroids accounting for the 50-point moving average of the trend of the star’s movement in the Y-axis. This feature does not alter the raw data in any way, just what is displayed in the graph and in the table.
X/Y in arc-seconds : If checked, will multiply the X/Y centroids by the Image scale you entered in the setup page. It will also repaint the graph.
X-Drift: approximate drift in the X-Axis (horizontal) arc-seconds/second. This is only an approximate and can change considerably depending on the phase of the worm gear.
Y-Drift: approximate drift in the Y-Axis (vertical) in arc-seconds/second. This is only an approximate and can change considerably depending on the phase of the worm gear.
Initial Phase: Used internally to keep track of the phase of the curve between different PE data acquisition runs.