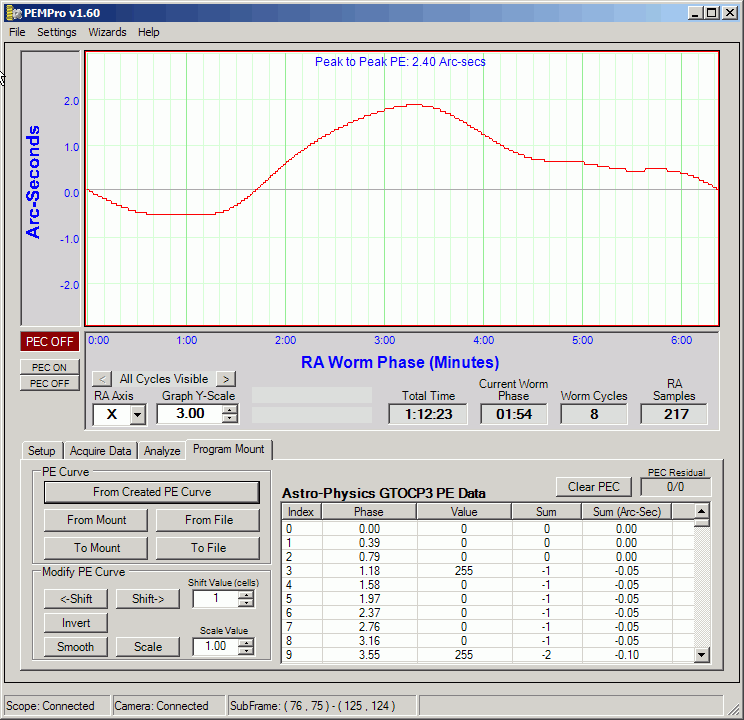
Below is the AP Raw PE tab before connecting to the mount. All the buttons and controls are disabled except the From File button and the Shift and Scale numeric up-down controls. If you click From File you can load in a previously saved PEC curve. The table will then fill with entries from the file and a graph of the curve will display.
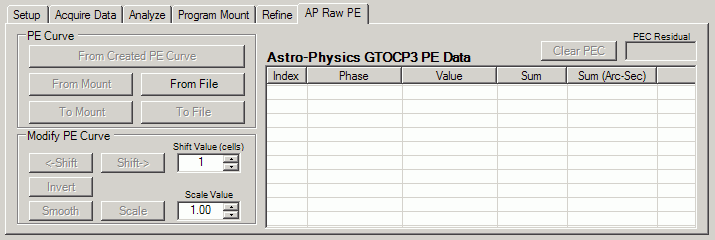
Once PEMPro is connected to the mount on the Setup tab, the From Mount button is enabled. Also the Firmware Rev is displayed, which should be a single ASCII letter. For instance, below this letter is "I". GTOCP3's are identified by their firmware revision. They are all Rev G or later.
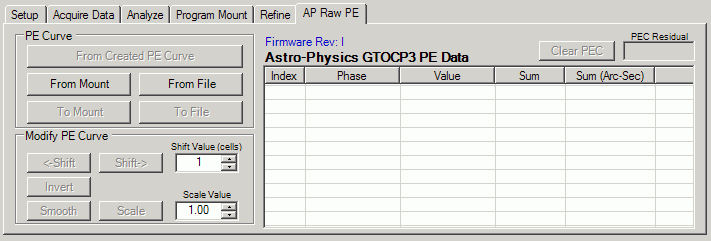
The From Created PE Curve button and all of the controls in the Modify PE Curve section are enabled if a curve has been created with the Create PE Curve dialog. Also all the controls will be enabled if a file is loaded with From File, or 3. From Mount is used to read the PE data.

Here is a summary of all of the controls:
From Created PE Curve: loads a PE curve that has just been created or loaded.
These are the functions you can do to the periodic error curve as a whole:
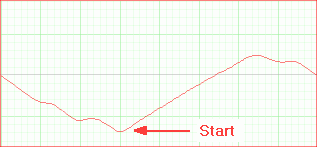
<-Shift - Shifts the curve left by the number of cells in the Shift Value field. The cells of the GTOCP3 vary depending on the worm period. There are 970 cells total which means that for a mount with 383 seconds, each cell is about 0.4 seconds. So the time shift of one cell is 0.4 seconds. Note that since the left hand edge of the graph always starts at 0 the whole level of the curve will change as you shift, however the shape and magnitude of the curve will not change. Here is a picture showing an example of shifting a curve:

-----------------------------------
Shift-> - Shifts the curve right by the number of cells in the Shift Value field. The cells of the GTOCP3 vary depending on the worm period. There are 970 cells total which means that for a mount with 383 seconds, each cell is about 0.4 seconds. So the time shift of one cell is 0.4 seconds. Note that since the left hand edge of the graph always starts at 0 the whole level of the curve will change as you shift, however the shape and magnitude of the curve will not change.
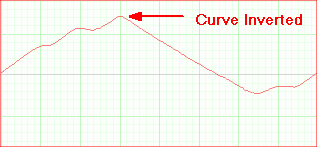
Invert - Inverts the curve as shown below. You would use this button on your curve if the curve causes the mount's periodic error to double instead of reducing it.

Smooth - Does a very modest smoothing of the curve. The Smoothing consists of doing a weighted average of each cell with its the two nearest neighbors.
Scale - Scales the curve by the factor in Scale Value. If a curve over or under corrects the periodic error of your mount you could use this to fix the curve without re-acquiring data.
Clear PEC - Fills the entire PEC table with 0's.
IMPORTANT: After making adjustments to a PEC curve with any of the above buttons you will need to write it to the mount with the To Mount button.
